
On this module, you can see and execute reports.
Load and execute a report
Once you enter the module, a pull-down menu will show the reports list. To load a report, choose the report that you want to load and press the button “GO!”
Once the report is loaded, it will show two sections:

- SQL: Here you can see the SQL of the report. Pressing the button “Show Values” you will see the SQL sentence with the replaced parameters if the report has been executed previously. If it is the first time the report is loaded, the parameters will be replaced for an empty value.
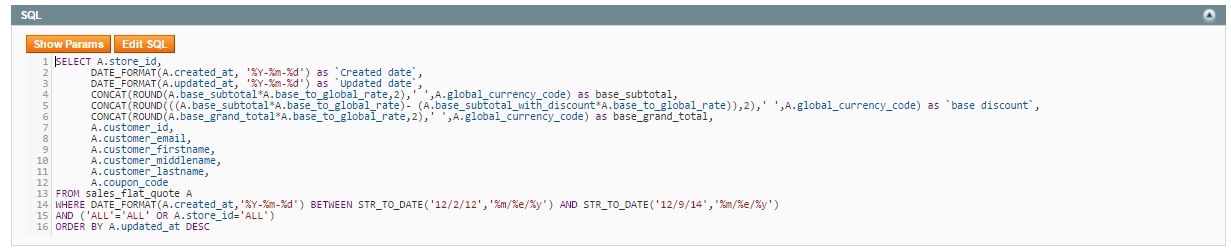
You can edit the sql to use clicking “Edit SQL” buttom, then you will able to edit the sql and the sentence to execute will be that SQL, but this sentence won’t saved.
Once the values of the parameters are shown, pressing the button “Show Params” we will see the SQL sentence with the parameters.
- Filter: Here you can give value the report parameters, all the parameters are compulsory

In the Select type filters, they will appear two buttons besides the selector.
![]() : Pressing this button, the sentence SQL of the filter will appear.
: Pressing this button, the sentence SQL of the filter will appear.
![]() : Pressing this button, it will take you to the setup module so that you can edit this filter.
: Pressing this button, it will take you to the setup module so that you can edit this filter.
In the Date type filters, it will appear this button beside the text field:
![]() : On pressing this button, it will appear a calendar so that you can choose one date.
: On pressing this button, it will appear a calendar so that you can choose one date.
Once the filter values are filled up to execute the report it is necessary to press the “Show Report” button.
Besides the “Show Report” button, it appears the button ![]() , and if you press it, you will be taken to the setup module to edit the loaded report.
, and if you press it, you will be taken to the setup module to edit the loaded report.
Report Display
Once a report is loaded, it will show us the execution data.

If the has assigned a chart, it will appear a new section called “Chart” with a chart drawing. Each type of chart is interactive; we could show and hide result without setting up the report again. The graph displays the data on the current page, to display the graph of all data, select “all” in the filter rows per page.
Down the “Filter” section we can see a square with the data. In the tables header it will show the names of the columns, being able to press on them to order them on that field, under the name, it will show boxes to filter data by that column. At the bottom of the table, it will appear a totals row, where we can see the total of the rows and if the values of the column are numbers, it will show the total of the values of the column.
We can export the data in two different formats:
- CSV: Plan files with values separated by character.
- Excel XML: Excel file.
- PDF: PDF file.
To export the data, we will choose the exportation type and press the button “Export”.
We can navigate through the pages of results by clicking on the arrows, also can change the number of rows per page.
![]()